Recap of last week
The essence of successful trading is betting big when you have an edge. I would put CPI as tied for the most important economic event alongside Jerome Powell and FOMC. It is pivotal. As long as inflation remains floating above 2%, the monthly CPI print will be the biggest mover of Fed Fund Futures and therefore the stock market.
We are one of the very few who have an edge in predicting CPI. Last week we went aggressively short ahead of the print. The result? The SPX had its largest down day of the entire year. 2.09% intraday. If you prefer on a closing basis, it was the 2nd largest down day of the year. After only the Jan 31 FOMC.
There is a distinct difference between “I feel like CPI may come in hot” vs “I looked at data that led me to believe with reasonable certainty that CPI will be hot”. Trading, at its core, is about developing repeatable, unemotional, systematic processes. Using these structures to evaluate potential trades without subjecting your decision making processes to the perils of human emotion. When left to our own devices, our mind often fails us. We notoriously sell assets when they are at the lows, and buy them at the highs. Having data to lean on, systematic processes mitigates that and allows your edge to dictate a profitable outcome over a large enough sample size to overcome short term variance.
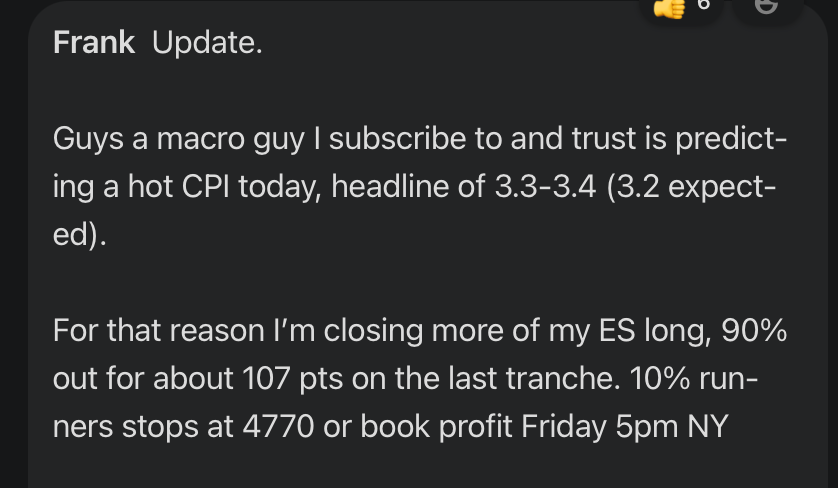
Last month’s CPI was no different. We predicted 3.3-3.4 over the 3.2 expectation and were right. My process involves 3-4 different entities and individuals. I pay for the relevant research myself and cross reference across these independent sources. If all 3/4 (which are uncorrelated and devised from different data) point in the same direction, that is when I have the conviction to take a directional trade prior to the news.
This major market moving event is happening 10 more times this year, if you are going into the event with nothing but a feeling or a hunch, while sophisticated market operators have actual data that can predict CPI (to a reasonable degree of confidence) you might as well take your money to the casino and lose it that way. It will be more fun at least.
Although having an edge isn’t enough. You need to be able to execute. Specifically speaking, when do you enter a trade and when do you exit.
Here is us exiting at within 2 points of the high of the entire year. This exit is from me knowing the short term direction (next 24-48 hours) due to the incoming hot CPI, knowing what an intra day top looks like (watch E minis trade during NY session for maybe 4-5 years) and a bit of game theory. Sure, and a bit of luck. But just a bit.
So on top of being heavily leveraged short before the biggest down day of the year, we caught the 30 point afternoon selloff on Monday pre-CPI.
Now after such a huge winner, I often like to take it easy the rest of the week. As they say, you don’t want to force a trade, you want to be forced to trade. Early Thursday morning, during the London open at 3AM NY time, I sat there watching the Europeans conduct their auction. I was ready to start my 5 day weekend, but watching the tape I thought to myself. There is no way I can’t be long right now. So I got long 5027 ES and we proceeded to rally about 30 points from there to end the week.
All in all, a huge winning week where we took money out of the market at will.
Onto the main event of earnings season next week. Everyone’s favorite/most hated stock, NVDA.
Next move for markets
Down. This is one of those rare instances where the data overwhelmingly points in one direction. Bearish. If you look at trading in terms of probabilities, which I do, there is no other trade to take here but short. It’s pretty simple and I will post the most salient points of data that I have aggregated from various banks/financial institutions on the 2H of February over the years.
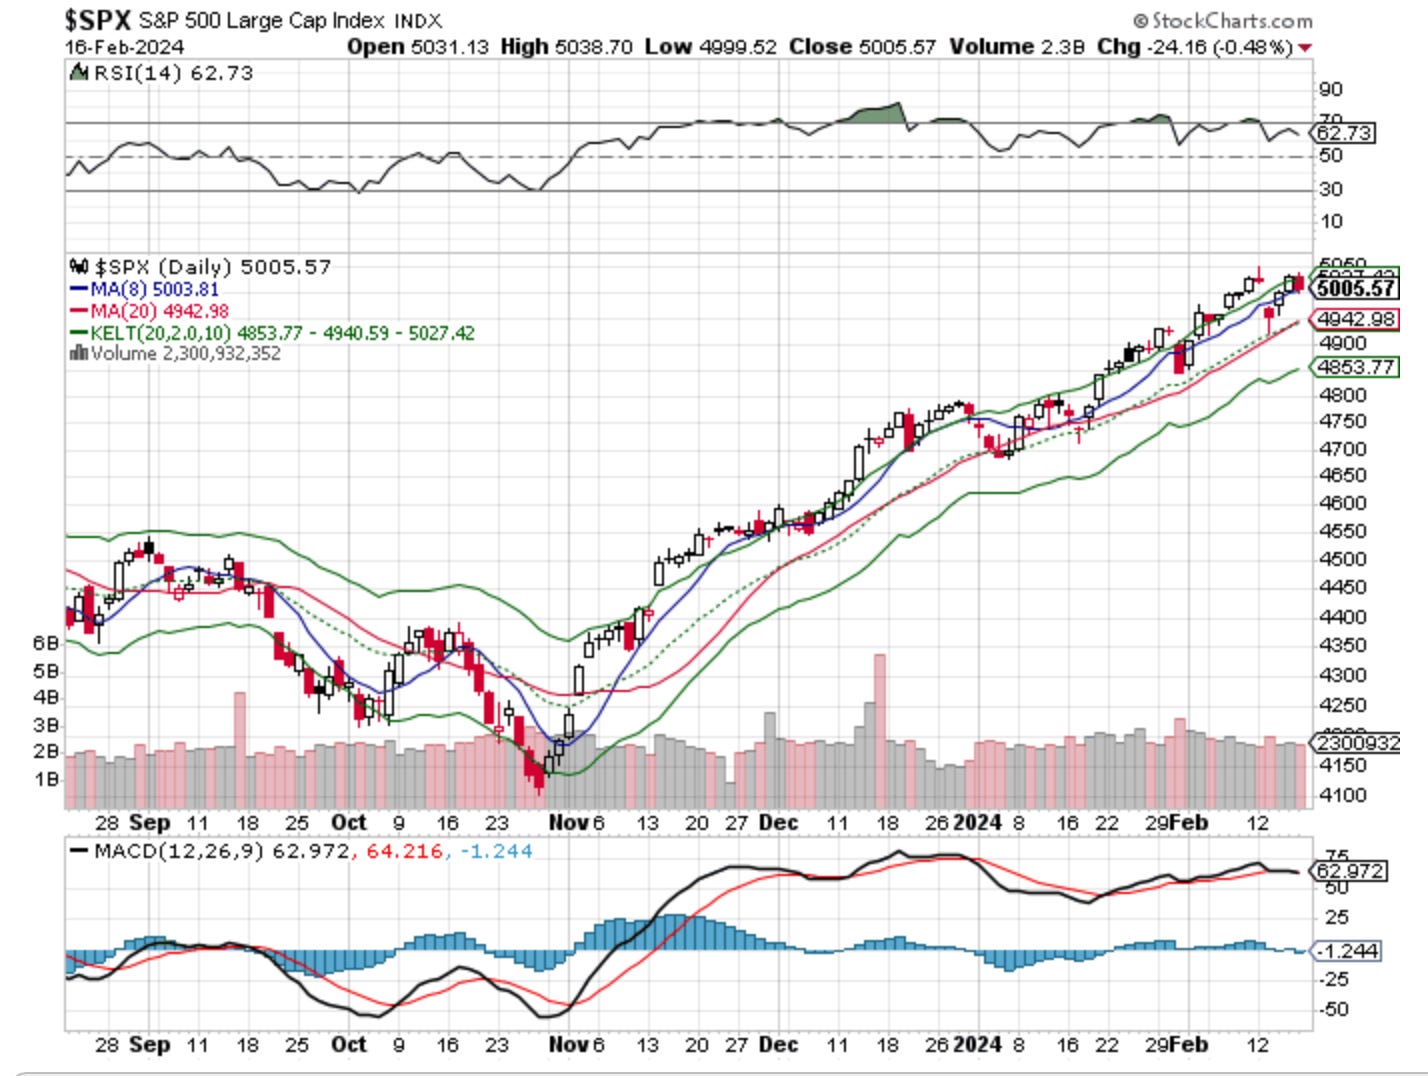
It looks like a double top at around 5060 ES was made this week. The actual top was on Monday when we bought our puts, and it looks like Friday afternoon was the lower high. Now momentum is turning down with RSI dipping back below 70 and closing in on the midline, MACD is crossing, and all general trend indicators are pointing down. It is the same with SMH which I consider the leader of this AI/tech driven rally. I think given the technical rejection of 5060 ES, and given the ultra bearish seasonal, we can at minimum expect a retest of the 20MA of 4942.98 where I will be taking profit on some of my puts.
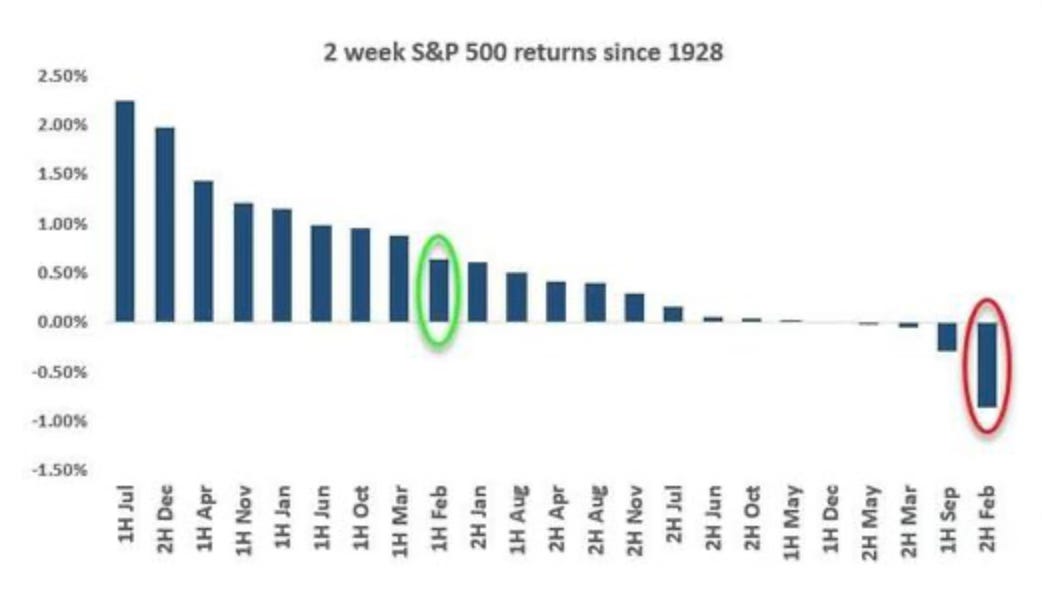
There is bearish seasonality, and then there is bearish seasonality. This is the latter. As you can see 2H Feb is dead last in 2 week returns. It even performs worse than September. Although, I think it’s worth mentioning here, it is not the worst week of the year. That honour goes to the 3rd week of September. But combined into 2-week segments, it is indeed the worst 2-week segment of the entire year to be long the S&P 500.
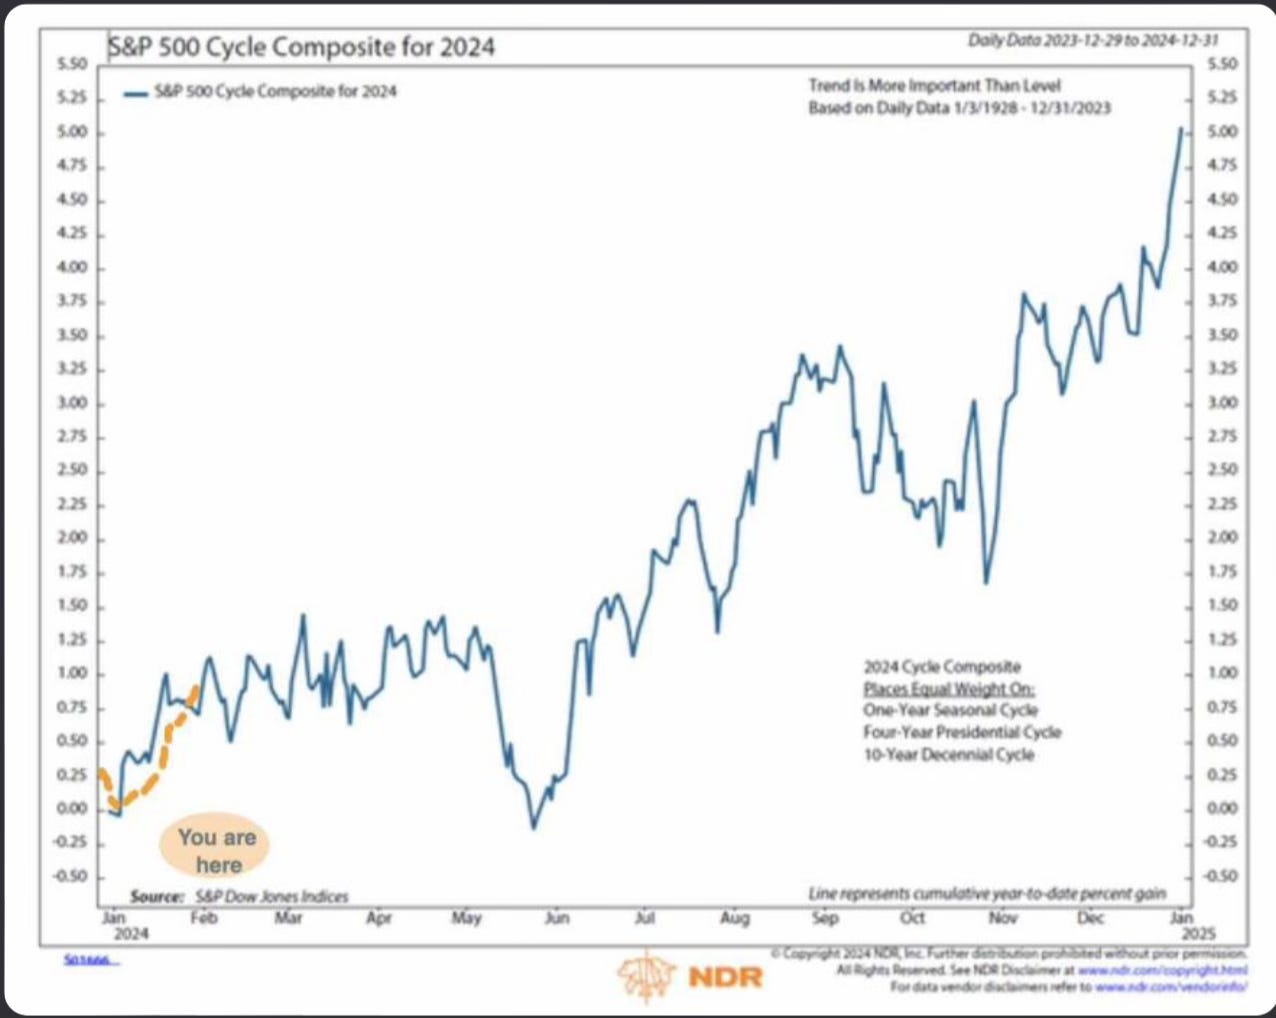
There is the ubiquitous SPX seasonal chart that everyone knows, but I prefer this more detailed one that incorporates the election cycle as well. Ignore the you are here sign. You can see mid to late February into March there is a steep downtrend.
This seasonal SPX chart by Goldman shows the average return by calendar day. I wouldn’t read too much to the specific numbers, but the main gist of it is the 3rd week of February which we are entering, is historically very bearish. I am looking at Feb 19-23. Every single one of those days has an average negative return. That is quite notable considering the average return for the SPX yearly is around 10%, meaning the average return of 1 calendar day is positive. So even a 0.0% average return can be considered a bearish day. It is essentially September, but in February.
I find it tough to trade seasonality without some sort of rational or logical explanation behind why. There are many spurious correlations out there that occur simply due to variance. However, I think February bearishness can be easily explained. I believe it is primarily due to the inflow tsunami of the first month of the year being exhausted. There is alot of pulled forward demand for assets in January. That is when year-end bonuses get deployed, holiday money gets handed out, and in many cases the new year brings in new contributions to tax-advantaged accounts which provides investors an impetus to invest new money into the market with urgency. Every country has some version of this. Here in Canada we have our TFSA (tax free savings account) that allows individuals to contribute an additional $8,000 or so on January 1. The past year they also introduced something called the FHSA (first home savings account) which provides individuals a tax free vehicle to invest provided they use the proceeds to purchase a home. It also grants an additional $8,000 of contribution room, you guessed it, on January 1. People generally max that out as soon as they can. January is such a big month for inflows and it naturally follows that we see some mean reversion in February. After all, who is the incremental buyer after everyone front loaded investments in January?
I think the seasonal all point pretty clearly to a bearish resolution. But that’s not enough. People trading seasonal got long the first week of January got fucked. People who got bearish the last week of January even though the seasonal suggested that, got fucked. We need more confirmation. As I referenced earlier, we got the all important technical price action confirmation. SPX could not bid above Monday highs. I also consider it very telling because it happened in the context of OpenAI’s release of the Sora AI text-to-video tool. AMAT also had blowout earnings foreshadowing SMH strength. The fact it could not make new highs on Friday sent off warning bells in my head. When the fastest horse in the face comes out looking tired and lethargic, it doesn’t bode well for the others (sectors).
Here are a couple other things that swing in the bears favour this week.
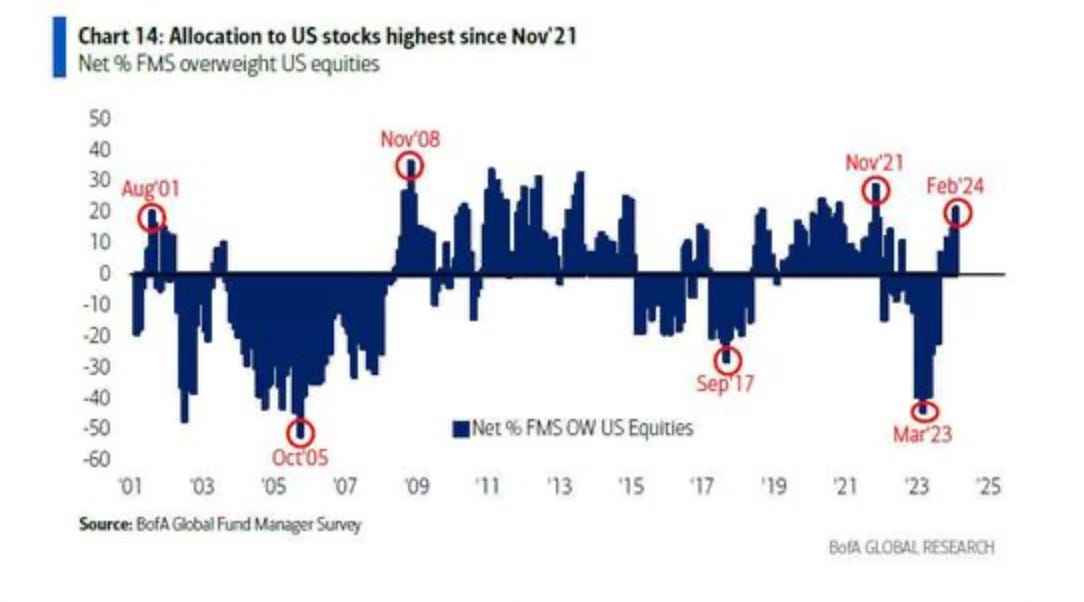
Almost everybody is in the pool. Surely everyone who FOMOd in will make money, right? …Right?
My trusyt GS sentiment indicator says we are stretched. This usually doesn’t mean we sell off immediately, but it’s yet another data point in favour of the bears. Confluence is key.
Lastly, the reason why February is not as notorious as say September for being a bearish period for stocks is that its generally very bifurcated. Call it two halves. The first half tends to be fairly strong, while the second half tends to be fairly weak. So if you look at just the monthly average February returns, they tend to be ho-hum. It kind of flies under the radar that way. But beneath the surface, if you look at it from a more granular perspective, the data reveals something more sinister. BofA has the last 10 days up only 46.24% of the time. My data shows that the SPX in any particular 2-week period in a random sample is up 58.6% of the time. So the delta of bearishness to be quantified in % terms is a stunning 12.36%. That is data over 96 years. That is very statistically significant considering the sample size.
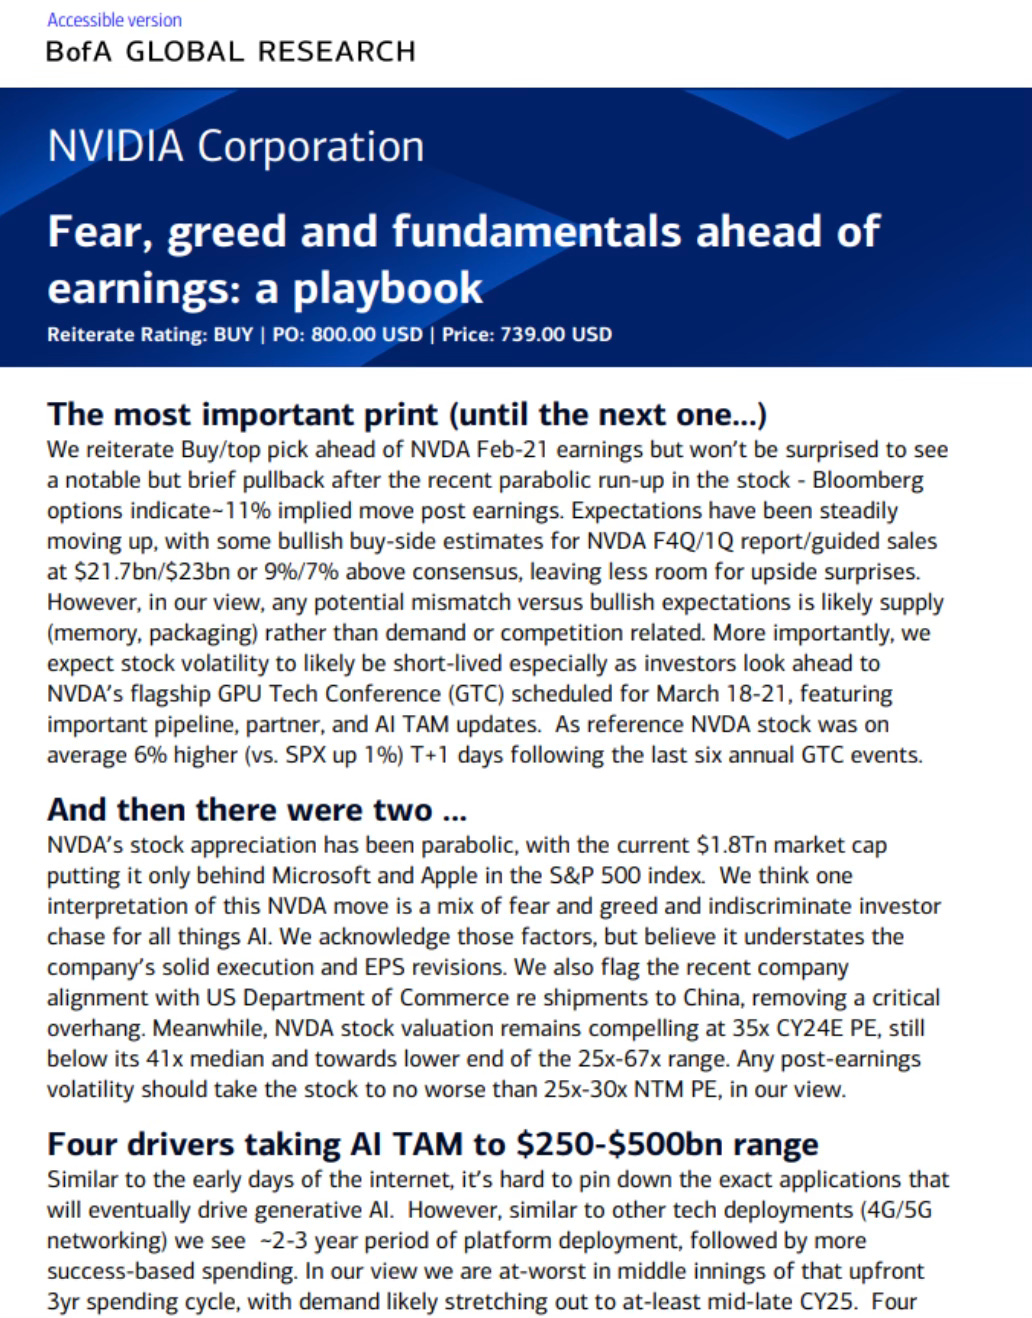
Here is what BofA has to say about NVDA.
So to sum up. This is a fairly easy week to trade. If you are basing your trading decisions on data, analytics, and probabilities, there is only one trade to take this week. Short. That is enough on its own. But we have even more confirmation from price (SPX rejecting 5050), sentiment, and positioning. My initial target is the 20DMA at 4940 SPX, where I will be taking profit on most of my puts. The second half of the week will be determined by what transpires during the NVDA earnings call, and price action leading into it. You can expect my typical updates through the Substack chat.
Trade Ideas:
We are long SPY 495 puts for 4.55. March 15 expiration.







Growth and inflation keep surprising to the upside so I would lean bearish bonds. But I dont really see a great risk/reward setup either way here. January CPI/PPI tends to be an outlier in many years so I think many bond traders waiting for confirmation of a nascent inflation spike from next months print.
Just joined. Where do you post your trades? I haven't used Substack before for trading. Thanks!